Heiken Ashi Swing Range FilterIt uses heiken-ashi candles to find swing highs and lows, then check if candles are inside the range of them. This way you can filter out ranging market.
It may be better to use it in higher timeframe than current.
In den Scripts nach "swing high" suchen
Divergence for Many Panel (D4MP+)Divergence for Many Panel (D4MP+)
This Divergence for Many Panel indicator is built upon the realtme divergence drawing code originally authored by LonesomeTheBlue, now in the form of a panel indicator.
The available oscillators, hand picked for their ability to identify high quality divergences currently include:
- Ultimate Oscillator (UO)
- True Strength Index (TSI)
- Money Flow Index (MFI)
- Relative Strength Index (RSI)
- Stochastic RSI
- Time Segmented Volume (TSV)
- Cumulative Delta Volume (CDV)
Note : this list of available oscillators may be added to or altered at a later date.
The indicator includes the following features:
- Ability to select any of the above oscillators
- Optional divergence lines drawn directly onto the oscillator in realtime .
- Configurable alerts to notify you when divergences occur.
- Configurable pivot lookback periods to fine tune the divergences drawn in order to suit different trading styles and timeframes, including the ability to enable automatic adjustment of pivot period per chart timeframe.
- Background colouring option to indicate when the selected oscillator has crossed above or below its centerline.
- Alternate timeframe feature allows you to configure the oscillator to use data from a different timeframe than the chart it is loaded on.
- Oscillator name label, so you can clearly see which oscillator is selected, in the case you have multiple loaded onto a chart.
- Optional adjustable range bands.
- Automatic adjustment of line colours, centerlines and range band levels on a per oscillator basis by default.
- Ability to customise the colours of each of the oscillators.
What is the Ultimate Oscillator ( UO )?
“The Ultimate Oscillator indicator (UO) indicator is a technical analysis tool used to measure momentum across three varying timeframes. The problem with many momentum oscillators is that after a rapid advance or decline in price, they can form false divergence trading signals. For example, after a rapid rise in price, a bearish divergence signal may present itself, however price continues to rise. The ultimate Oscillator attempts to correct this by using multiple timeframes in its calculation as opposed to just one timeframe which is what is used in most other momentum oscillators.”
What is the True Strength Index ( TSI )?
"The true strength index (TSI) is a technical momentum oscillator used to identify trends and reversals. The indicator may be useful for determining overbought and oversold conditions, indicating potential trend direction changes via centerline or signal line crossovers, and warning of trend weakness through divergence."
What is the Money Flow Index ( MFI )?
“The Money Flow Index ( MFI ) is a technical oscillator that uses price and volume data for identifying overbought or oversold signals in an asset. It can also be used to spot divergences which warn of a trend change in price. The oscillator moves between 0 and 100. Unlike conventional oscillators such as the Relative Strength Index ( RSI ), the Money Flow Index incorporates both price and volume data, as opposed to just price. For this reason, some analysts call MFI the volume-weighted RSI .”
What is the Relative Strength Index ( RSI )?
"The relative strength index (RSI) is a momentum indicator used in technical analysis. RSI measures the speed and magnitude of a security's recent price changes to evaluate overvalued or undervalued conditions in the price of that security. The RSI can do more than point to overbought and oversold securities. It can also indicate securities that may be primed for a trend reversal or corrective pullback in price. It can signal when to buy and sell. Traditionally, an RSI reading of 70 or above indicates an overbought situation. A reading of 30 or below indicates an oversold condition. It is also commonly used to identify divergences."
What is the Stochastic RSI (StochRSI)?
"The Stochastic RSI (StochRSI) is an indicator used in technical analysis that ranges between zero and one (or zero and 100 on some charting platforms) and is created by applying the Stochastic oscillator formula to a set of relative strength index (RSI) values rather than to standard price data. Using RSI values within the Stochastic formula gives traders an idea of whether the current RSI value is overbought or oversold. The StochRSI oscillator was developed to take advantage of both momentum indicators in order to create a more sensitive indicator that is attuned to a specific security's historical performance rather than a generalized analysis of price change."
What Is Time Segmented Volume?
"Time segmented volume (TSV) is a technical analysis indicator developed by Worden Brothers Inc. that segments a stock's price and volume according to specific time intervals. The price and volume data is then compared to uncover periods of accumulation (buying) and distribution (selling)."
What is Cumulative Volume Delta ( CDV )?
"The CDV analyses the net buying at market price and net selling at market price. This means, that volume delta is measuring whether it is the buyers or sellers that are more aggressive in taking the current market price. It measures the degree of intent by buyers and sellers, which can be used to indicate who is more dominant. The CDV can be used to help identify possible trends and also divergences"
What are divergences?
Divergence is when the price of an asset is moving in the opposite direction of a technical indicator, such as an oscillator, or is moving contrary to other data. Divergence warns that the current price trend may be weakening, and in some cases may lead to the price changing direction.
There are 4 main types of divergence, which are split into 2 categories;
regular divergences and hidden divergences. Regular divergences indicate possible trend reversals, and hidden divergences indicate possible trend continuation.
Regular bullish divergence: An indication of a potential trend reversal, from the current downtrend, to an uptrend.
Regular bearish divergence: An indication of a potential trend reversal, from the current uptrend, to a downtrend.
Hidden bullish divergence: An indication of a potential uptrend continuation.
Hidden bearish divergence: An indication of a potential downtrend continuation.
Setting alerts.
With this indicator you can set alerts to notify you when any/all of the above types of divergences occur, on any chart timeframe you choose.
Configurable pivot periods.
You can adjust the default pivot periods to suit your prefered trading style and timeframe. If you like to trade a shorter time frame, lowering the default lookback values will make the divergences drawn more sensitive to short term price action.
How do traders use divergences in their trading?
A divergence is considered a leading indicator in technical analysis , meaning it has the ability to indicate a potential price move in the short term future.
Hidden bullish and hidden bearish divergences, which indicate a potential continuation of the current trend are sometimes considered a good place for traders to begin, since trend continuation occurs more frequently than reversals, or trend changes.
When trading regular bullish divergences and regular bearish divergences, which are indications of a trend reversal, the probability of it doing so may increase when these occur at a strong support or resistance level . A common mistake new traders make is to get into a regular divergence trade too early, assuming it will immediately reverse, but these can continue to form for some time before the trend eventually changes, by using forms of support or resistance as an added confluence, such as when price reaches a moving average, the success rate when trading these patterns may increase.
Typically, traders will manually draw lines across the swing highs and swing lows of both the price chart and the oscillator to see whether they appear to present a divergence, this indicator will draw them for you, quickly and clearly, and can notify you when they occur.
Disclaimer : This script includes code from several stock indicators by Tradingview as well as the Divergence for Many Indicators v4 by LonesomeTheBlue. With special thanks.

MFI + Realtime DivergencesMoney Flow Index (MFI) + Realtime Divergences + Alerts
This version of the MFI indicator adds the following 5 additional features to the stock MFI:
- Optional divergence lines drawn directly onto the oscillator in realtime.
- Configurable alerts to notify you when divergences occur.
- Configurable lookback periods to fine tune the divergences drawn in order to suit different trading styles and timeframes, including the ability to enable automatic adjustment of pivot period per chart timeframe.
- Background colouring option to indicate when the MFI oscillator has crossed above or below its centerline, or optionally when both the MFI has crossed its centerline and an external oscillator, which can be linked via the settings, has also crossed its centerline.
- Alternate timeframe feature allows you to configure the oscillator to use data from a different timeframe than the chart it is loaded on.
This indicator adds additional features onto the standard MFI , whose core calculations remain unchanged. Namely the configurable option to automatically, quickly and clearly draw divergence lines onto the oscillator for you as they occur in realtime. It also has the addition of unique alerts, so you can be notified when divergences occur without spending all day watching the charts. Furthermore, this version of the TSI comes with configurable lookback periods, which can be configured in order to adjust the sensitivity of the divergences, in order to suit shorter or higher timeframe trading approaches.
What is the Money Flow Index ( MFI )?
Investopedia describes the True Strength Indicator as follows:
“The Money Flow Index ( MFI ) is a technical oscillator that uses price and volume data for identifying overbought or oversold signals in an asset. It can also be used to spot divergences which warn of a trend change in price. The oscillator moves between 0 and 100.
Unlike conventional oscillators such as the Relative Strength Index ( RSI ), the Money Flow Index incorporates both price and volume data, as opposed to just price. For this reason, some analysts call MFI the volume-weighted RSI .”
What are divergences?
Divergence is when the price of an asset is moving in the opposite direction of a technical indicator, such as an oscillator, or is moving contrary to other data. Divergence warns that the current price trend may be weakening, and in some cases may lead to the price changing direction.
There are 4 main types of divergence, which are split into 2 categories;
regular divergences and hidden divergences. Regular divergences indicate possible trend reversals, and hidden divergences indicate possible trend continuation.
Regular bullish divergence: An indication of a potential trend reversal, from the current downtrend, to an uptrend.
Regular bearish divergence: An indication of a potential trend reversal, from the current uptrend, to a downtrend.
Hidden bullish divergence: An indication of a potential uptrend continuation.
Hidden bearish divergence: An indication of a potential downtrend continuation.
Setting alerts.
With this indicator you can set alerts to notify you when any/all of the above types of divergences occur, on any chart timeframe you choose.
Configurable pivot periods.
You can adjust the default pivot periods to suit your prefered trading style and timeframe. If you like to trade a shorter time frame, lowering the default lookback values will make the divergences drawn more sensitive to short term price action.
How do traders use divergences in their trading?
A divergence is considered a leading indicator in technical analysis , meaning it has the ability to indicate a potential price move in the short term future.
Hidden bullish and hidden bearish divergences, which indicate a potential continuation of the current trend are sometimes considered a good place for traders to begin, since trend continuation occurs more frequently than reversals, or trend changes.
When trading regular bullish divergences and regular bearish divergences, which are indications of a trend reversal, the probability of it doing so may increase when these occur at a strong support or resistance level . A common mistake new traders make is to get into a regular divergence trade too early, assuming it will immediately reverse, but these can continue to form for some time before the trend eventually changes, by using forms of support or resistance as an added confluence, such as when price reaches a moving average, the success rate when trading these patterns may increase.
Typically, traders will manually draw lines across the swing highs and swing lows of both the price chart and the oscillator to see whether they appear to present a divergence, this indicator will draw them for you, quickly and clearly, and can notify you when they occur.
Disclaimer: This script includes code from the stock MFI by Tradingview as well as the Divergence for Many Indicators v4 by LonesomeTheBlue.

Simple and Profitable Scalping Strategy (ForexSignals TV)Strategy is based on the "SIMPLE and PROFITABLE Forex Scalping Strategy" taken from YouTube channel ForexSignals TV.
See video for a detailed explaination of the whole strategy.
I'm not entirely happy with the performance of this strategy yet however I do believe it has potential as the concept makes a lot of sense.
I'm open to any ideas people have on how it could be improved.
Strategy incorporates the following features:
Risk management:
Configurable X% loss per stop (default to 1%)
Configurable R:R ratio
Trade entry:
Based on stratgey conditions outlined below
Trade exit:
Based on stratgey conditions outlined below
Backtesting:
Configurable backtesting range by date
Trade drawings:
Each entry condition indicator can be turned on and off
TP/SL boxes drawn for all trades. Can be turned on and off
Trade exit information labels. Can be turned on and off
NOTE: Trade drawings will only be applicable when using overlay strategies
Debugging:
Includes section with useful debugging techniques
Strategy conditions
Trade entry:
LONG
C1: On higher timeframe trend EMAs, Fast EMA must be above Slow EMA
C2: On higher timeframe trend EMAs, price must be above Fast EMA
C3: On current timeframe entry EMAs, Fast EMA must be above Medium EMA and Medium EMA must be above Slow EMA
C4: On current timeframe entry EMAs, all 3 EMA lines must have fanned out in upward direction for previous X candles (configurable)
C5: On current timeframe entry EMAs, previous candle must have closed above and not touched any EMA lines
C6: On current timeframe entry EMAs, current candle must have pulled back to touch the EMA line(s)
C7: Price must break through the high of the last X candles (plus price buffer) to trigger entry (stop order entry)
SHORT
C1: On higher timeframe trend EMAs, Fast EMA must be below Slow EMA
C2: On higher timeframe trend EMAs, price must be below Fast EMA
C3: On current timeframe entry EMAs, Fast EMA must be below Medium EMA and Medium EMA must be below Slow EMA
C4: On current timeframe entry EMAs, all 3 EMA lines must have fanned out in downward direction for previous X candles (configurable)
C5: On current timeframe entry EMAs, previous candle must have closed above and not touched any EMA lines
C6: On current timeframe entry EMAs, current candle must have pulled back to touch the EMA line(s)
C7: Price must break through the low of the last X candles (plus price buffer) to trigger entry (stop order entry)
Trade entry:
Calculated position size based on risk tolerance
Entry price is a stop order set just above (buffer configurable) the recent swing high/low (long/short)
Trade exit:
Stop Loss is set just below (buffer configurable) trigger candle's low/high (long/short)
Take Profit calculated from Stop Loss using R:R ratio
Credits
"SIMPLE and PROFITABLE Forex Scalping Strategy" taken from YouTube channel ForexSignals TV

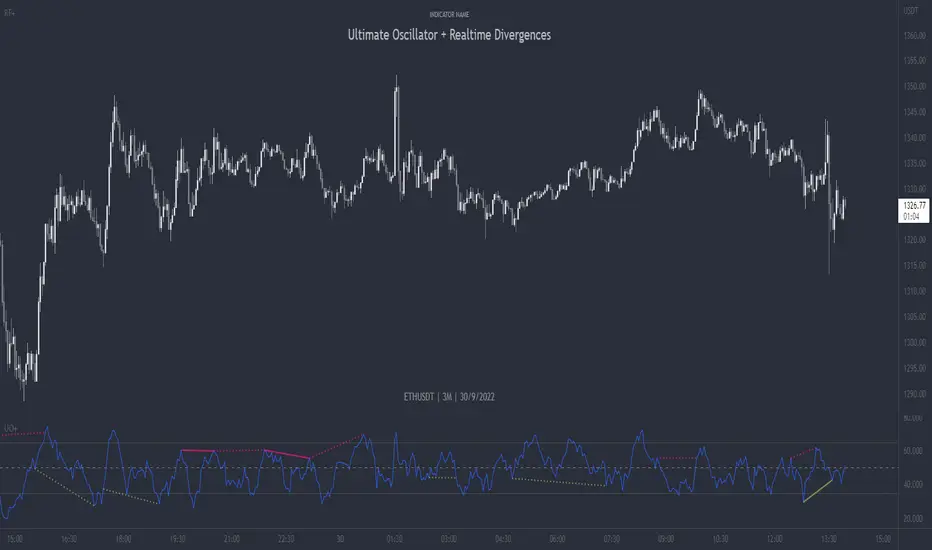
Ultimate Oscillator + Realtime DivergencesUltimate Oscillator (UO) + Realtime Divergences + Alerts + Lookback periods.
This version of the Ultimate Oscillator adds the following 5 additional features to the stock UO by Tradingview:
- Optional divergence lines drawn directly onto the oscillator in realtime
- Configurable alerts to notify you when divergences occur, as well as centerline crossovers.
- Configurable lookback periods to fine tune the divergences drawn in order to suit different trading styles and timeframes.
- Background colouring option to indicate when the UO has crossed the centerline, or optionally when both the UO and an external oscillator, which can be linked via the settings, have both crossed their centerlines.
- Alternate timeframe feature allows you to configure the oscillator to use data from a different timeframe than the chart it is loaded on.
This indicator adds additional features onto the stock Ultimate Oscillator by Tradingview, whose core calculations remain unchanged. Namely the configurable option to automatically and clearly draw divergence lines onto the oscillator for you as they occur in realtime. It also has the addition of unique alerts, so you can be notified as divergences occur without spending all day watching the charts. Furthermore, this version of the Ultimate Oscillator comes with configurable lookback periods, which can be configured in order to adjust the length of the divergences, in order to suit shorter or higher timeframe trading approaches.
The Ultimate Oscillator
Tradingview describes the Ultimate Oscillator as follows:
“The Ultimate Oscillator indicator (UO) indicator is a technical analysis tool used to measure momentum across three varying timeframes. The problem with many momentum oscillators is that after a rapid advance or decline in price, they can form false divergence trading signals. For example, after a rapid rise in price, a bearish divergence signal may present itself, however price continues to rise. The ultimate Oscillator attempts to correct this by using multiple timeframes in its calculation as opposed to just one timeframe which is what is used in most other momentum oscillators.”
More information on the history, use cases and calculations of the Ultimate Oscillator can be found here: www.tradingview.com
What are divergences?
Divergence is when the price of an asset is moving in the opposite direction of a technical indicator, such as an oscillator, or is moving contrary to other data. Divergence warns that the current price trend may be weakening, and in some cases may lead to the price changing direction.
There are 4 main types of divergence, which are split into 2 categories;
regular divergences and hidden divergences. Regular divergences indicate possible trend reversals, and hidden divergences indicate possible trend continuation.
Regular bullish divergence: An indication of a potential trend reversal, from the current downtrend, to an uptrend.
Regular bearish divergence: An indication of a potential trend reversal, from the current uptrend, to a downtrend.
Hidden bullish divergence: An indication of a potential uptrend continuation.
Hidden bearish divergence: An indication of a potential downtrend continuation.
Setting alerts.
With this indicator you can set alerts to notify you when any/all of the above types of divergences occur, on any chart timeframe you choose.
Configurable lookback values.
You can adjust the default lookback values to suit your prefered trading style and timeframe. If you like to trade a shorter time frame, lowering the default lookback values will make the divergences drawn more sensitive to short term price action.
How do traders use divergences in their trading?
A divergence is considered a leading indicator in technical analysis , meaning it has the ability to indicate a potential price move in the short term future.
Hidden bullish and hidden bearish divergences, which indicate a potential continuation of the current trend are sometimes considered a good place for traders to begin, since trend continuation occurs more frequently than reversals, or trend changes.
When trading regular bullish divergences and regular bearish divergences, which are indications of a trend reversal, the probability of it doing so may increase when these occur at a strong support or resistance level . A common mistake new traders make is to get into a regular divergence trade too early, assuming it will immediately reverse, but these can continue to form for some time before the trend eventually changes, by using forms of support or resistance as an added confluence, such as when price reaches a moving average, the success rate when trading these patterns may increase.
Typically, traders will manually draw lines across the swing highs and swing lows of both the price chart and the oscillator to see whether they appear to present a divergence, this indicator will draw them for you, quickly and clearly, and can notify you when they occur.
Disclaimer: This script includes code from the stock UO by Tradingview as well as the Divergence for Many Indicators v4 by LonesomeTheBlue.
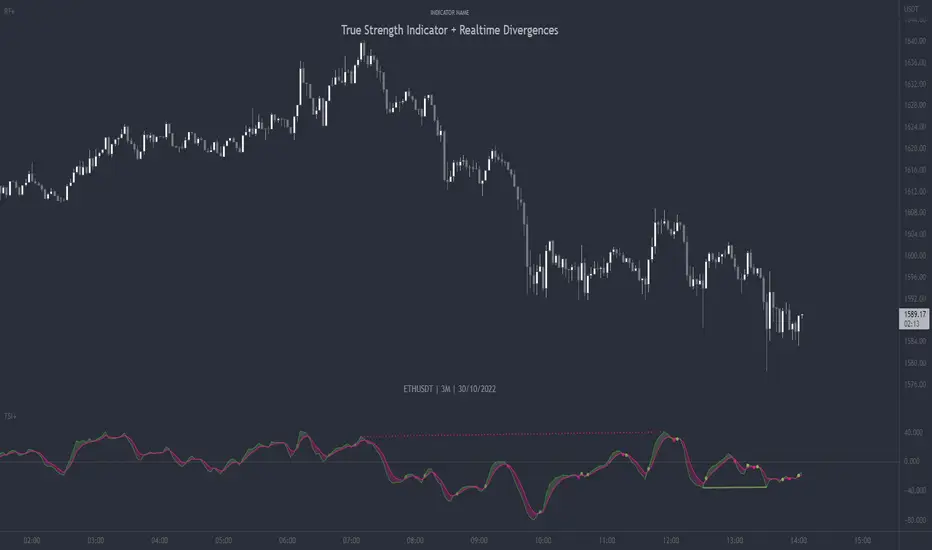
True Strength Indicator + Realtime DivergencesTrue Strength Indicator (TSI) + Realtime Divergences + Alerts + Lookback periods.
This version of the True Strength Indicator adds the following 5 additional features to the stock TSI by Tradingview:
- Optional divergence lines drawn directly onto the oscillator in realtime.
- Configurable alerts to notify you when divergences occur, as well as when the TSI and lagline bands crossover one another, when the oscillator begins heading up, or heading down.
- Configurable lookback periods to fine tune the divergences drawn in order to suit different trading styles and timeframes.
- Background colouring option to indicate when the two TSI bands, the TSI line and the TSI lagline, have crossed one another, either moving upwards or downwards, or optionally when the two TSI bands have crossed upwards and an external oscillator, which can be linked via the settings, has crossed above its centerline, and the TSI bands have crossed downwards and the external oscillator has crossed below its centerline.
- Alternate timeframe feature allows you to configure the oscillator to use data from a different timeframe than the chart it is loaded on.
This indicator adds additional features onto the stock TSI by Tradingview, whose core calculations remain unchanged, although this version has different settings as default to suit a shorter time period (it uses 6, 13, 4 by default, whereas the stock TSI typically ships with higher values, e.g. 25, 13, 13). Namely the configurable option to automatically, quickly and clearly draw divergence lines onto the oscillator for you as they occur in realtime. It also has the addition of unique alerts, so you can be notified when divergences occur without spending all day watching the charts. Furthermore, this version of the TSI comes with configurable lookback periods, which can be configured in order to adjust the sensitivity of the divergences, in order to suit shorter or higher timeframe trading approaches.
The True Strength Indicator
Tradingview describes the True Strength Indicator as follows:
“The True Strength Index (TSI) is a momentum oscillator that ranges between limits of -100 and +100 and has a base value of 0. Momentum is positive when the oscillator is positive (pointing to a bullish market bias) and vice versa. It was developed by William Blau and consists of 2 lines: the index line and an exponential moving average of the TSI, called the signal line. Traders may look for any of the following 5 types of conditions: overbought, oversold, centerline crossover, divergence and signal line crossover. The indicator is often used in combination with other signals..”
What are divergences?
Divergence is when the price of an asset is moving in the opposite direction of a technical indicator, such as an oscillator, or is moving contrary to other data. Divergence warns that the current price trend may be weakening, and in some cases may lead to the price changing direction.
There are 4 main types of divergence, which are split into 2 categories;
regular divergences and hidden divergences. Regular divergences indicate possible trend reversals, and hidden divergences indicate possible trend continuation.
Regular bullish divergence: An indication of a potential trend reversal, from the current downtrend, to an uptrend.
Regular bearish divergence: An indication of a potential trend reversal, from the current uptrend, to a downtrend.
Hidden bullish divergence: An indication of a potential uptrend continuation.
Hidden bearish divergence: An indication of a potential downtrend continuation.
Setting alerts.
With this indicator you can set alerts to notify you when any/all of the above types of divergences occur, on any chart timeframe you choose.
Configurable lookback values.
You can adjust the default lookback values to suit your prefered trading style and timeframe. If you like to trade a shorter time frame, lowering the default lookback values will make the divergences drawn more sensitive to short term price action.
How do traders use divergences in their trading?
A divergence is considered a leading indicator in technical analysis , meaning it has the ability to indicate a potential price move in the short term future.
Hidden bullish and hidden bearish divergences, which indicate a potential continuation of the current trend are sometimes considered a good place for traders to begin, since trend continuation occurs more frequently than reversals, or trend changes.
When trading regular bullish divergences and regular bearish divergences, which are indications of a trend reversal, the probability of it doing so may increase when these occur at a strong support or resistance level . A common mistake new traders make is to get into a regular divergence trade too early, assuming it will immediately reverse, but these can continue to form for some time before the trend eventually changes, by using forms of support or resistance as an added confluence, such as when price reaches a moving average, the success rate when trading these patterns may increase.
Typically, traders will manually draw lines across the swing highs and swing lows of both the price chart and the oscillator to see whether they appear to present a divergence, this indicator will draw them for you, quickly and clearly, and can notify you when they occur.
Disclaimer: This script includes code from the stock TSI by Tradingview as well as the Divergence for Many Indicators v4 by LonesomeTheBlue
TSI + DivergencesTrue Strength Indicator (TSI) + Divergences + Alerts + Lookback periods.
This version of the True Strength Indicator adds the following 3 additional features to the stock TSI by Tradingview:
- Optional divergence lines drawn directly onto the oscillator.
- Configurable alerts to notify you when divergences occur.
- Configurable lookback periods to fine tune the divergences drawn in order to suit different trading styles and timeframes.
This indicator adds additional features onto the stock TSI by Tradingview, whose core calculations remain unchanged. Namely the configurable option to automatically, quickly and clearly draw divergence lines onto the oscillator for you as they occur, with minimal delay. It also has the addition of unique alerts, so you can be notified when divergences occur without spending all day watching the charts. Furthermore, this version of the TSI comes with configurable lookback periods, which can be configured in order to adjust the sensitivity of the divergences, in order to suit shorter or higher timeframe trading approaches.
The True Strength Indicator
Tradingview describes the True Strength Indicator as follows:
“The True Strength Index (TSI) is a momentum oscillator that ranges between limits of -100 and +100 and has a base value of 0. Momentum is positive when the oscillator is positive (pointing to a bullish market bias) and vice versa. It was developed by William Blau and consists of 2 lines: the index line and an exponential moving average of the TSI, called the signal line. Traders may look for any of the following 5 types of conditions: overbought, oversold, centerline crossover, divergence and signal line crossover. The indicator is often used in combination with other signals..”
What are divergences?
Divergence is when the price of an asset is moving in the opposite direction of a technical indicator, such as an oscillator, or is moving contrary to other data. Divergence warns that the current price trend may be weakening, and in some cases may lead to the price changing direction.
There are 4 main types of divergence, which are split into 2 categories;
regular divergences and hidden divergences. Regular divergences indicate possible trend reversals, and hidden divergences indicate possible trend continuation.
Regular bullish divergence: An indication of a potential trend reversal, from the current downtrend, to an uptrend.
Regular bearish divergence: An indication of a potential trend reversal, from the current uptrend, to a downtrend.
Hidden bullish divergence: An indication of a potential uptrend continuation.
Hidden bearish divergence: An indication of a potential downtrend continuation.
Setting alerts.
With this indicator you can set alerts to notify you when any/all of the above types of divergences occur, on any chart timeframe you choose.
Configurable lookback values.
You can adjust the default lookback values to suit your prefered trading style and timeframe. If you like to trade a shorter time frame, lowering the default lookback values will make the divergences drawn more sensitive to short term price action.
How do traders use divergences in their trading?
A divergence is considered a leading indicator in technical analysis, meaning it has the ability to indicate a potential price move in the short term future.
Hidden bullish and hidden bearish divergences, which indicate a potential continuation of the current trend are sometimes considered a good place for traders to begin, since trend continuation occurs more frequently than reversals, or trend changes.
When trading regular bullish divergences and regular bearish divergences, which are indications of a trend reversal, the probability of it doing so may increase when these occur at a strong support or resistance level. A common mistake new traders make is to get into a regular divergence trade too early, assuming it will immediately reverse, but these can continue to form for some time before the trend eventually changes, by using forms of support or resistance as an added confluence, such as when price reaches a moving average, the success rate when trading these patterns may increase.
Typically, traders will manually draw lines across the swing highs and swing lows of both the price chart and the oscillator to see whether they appear to present a divergence, this indicator will draw them for you, quickly and clearly, and can notify you when they occur.
Disclaimer : This script includes code from the stock TSI by Tradingview as well as the RSI divergence indicator.

Ultimate Oscillator + DivergencesUltimate Oscillator (UO) + Divergences + Alerts + Lookback periods.
This version of the Ultimate Oscillator adds the following 3 additional features to the stock UO by Tradingview:
- Optional divergence lines drawn directly onto the oscillator.
- Configurable alerts to notify you when divergences occur.
- Configurable lookback periods to fine tune the divergences drawn in order to suit different trading styles and timeframes.
This indicator adds additional features onto the stock Ultimate Oscillator by Tradingview, whose core calculations remain unchanged. Namely the configurable option to automatically, quickly and clearly draw divergence lines onto the oscillator for you as they occur, with minimal delay. It also has the addition of unique alerts, so you can be notified when divergences occur without spending all day watching the charts. Furthermore, this version of the Ultimate Oscillator comes with configurable lookback periods, which can be configured in order to adjust the sensitivity of the divergences, in order to suit shorter or higher timeframe trading approaches.
The Ultimate Oscillator
Tradingview describes the Ultimate Oscillator as follows:
“The Ultimate Oscillator indicator (UO) indicator is a technical analysis tool used to measure momentum across three varying timeframes. The problem with many momentum oscillators is that after a rapid advance or decline in price, they can form false divergence trading signals. For example, after a rapid rise in price, a bearish divergence signal may present itself, however price continues to rise. The ultimate Oscillator attempts to correct this by using multiple timeframes in its calculation as opposed to just one timeframe which is what is used in most other momentum oscillators.”
More information on the history, use cases and calculations of the Ultimate Oscillator can be found here: www.tradingview.com
What are divergences?
Divergence is when the price of an asset is moving in the opposite direction of a technical indicator, such as an oscillator, or is moving contrary to other data. Divergence warns that the current price trend may be weakening, and in some cases may lead to the price changing direction.
There are 4 main types of divergence, which are split into 2 categories;
regular divergences and hidden divergences . Regular divergences indicate possible trend reversals, and hidden divergences indicate possible trend continuation.
Regular bullish divergence: An indication of a potential trend reversal, from the current downtrend, to an uptrend.
Regular bearish divergence: An indication of a potential trend reversal, from the current uptrend, to a downtrend.
Hidden bullish divergence: An indication of a potential uptrend continuation.
Hidden bearish divergence: An indication of a potential downtrend continuation.
Setting alerts.
With this indicator you can set alerts to notify you when any/all of the above types of divergences occur, on any chart timeframe you choose.
Configurable lookback values.
You can adjust the default lookback values to suit your prefered trading style and timeframe. If you like to trade a shorter time frame, lowering the default lookback values will make the divergences drawn more sensitive to short term price action.
How do traders use divergences in their trading?
A divergence is considered a leading indicator in technical analysis, meaning it has the ability to indicate a potential price move in the short term future.
Hidden bullish and hidden bearish divergences, which indicate a potential continuation of the current trend are sometimes considered a good place for traders to begin, since trend continuation occurs more frequently than reversals, or trend changes.
When trading regular bullish divergences and regular bearish divergences, which are indications of a trend reversal, the probability of it doing so may increase when these occur at a strong support or resistance level. A common mistake new traders make is to get into a regular divergence trade too early, assuming it will immediately reverse, but these can continue to form for some time before the trend eventually changes, by using forms of support or resistance as an added confluence, such as when price reaches a moving average, the success rate when trading these patterns may increase.
Typically, traders will manually draw lines across the swing highs and swing lows of both the price chart and the oscillator to see whether they appear to present a divergence, this indicator will draw them for you, quickly and clearly, and can notify you when they occur.
Disclaimer : This script includes code from the stock UO by Tradingview as well as the RSI divergence indicator.
CANDLE FILTER Todays scripts is based on my Pullback And Rally Candles with other meaningful candles such as Hammers and Dojis.
You can choose which Candles to show on the cart and if you want to candles to appear above or below a moving average.
If you follow my work, you may recognise some of these candles which I'm about to show you however these candles are 1) more refined and 2) has moving average filters.
Ive included a D,6H,1H Candle in this script as on different timeframes - each swing low on average has a different amount of bars within the swing low / swing high so the DPB and RD will only work on the Daily
//Pullback candle
This candle is very powerful when used with simple Price Action such as Market Structure//Demand zones and support zones. (((((WORKS BEST IN UPTRENDS AND BOTTOM OF RANGES)))))
Ive included a D,6H,1H Pullback Candle in this script as on different timeframes - each swing low on average has a different amount of bars within the swing low so the DPB will only work on the Daily
//DAILY PULLBACK (Swing Traders)
snapshot
//4H PULLBACK (Swing Traders)
snapshot
- this signal will produce more signals due to the swing low filter on the 4H
//1H PULLBACK
snapshot
- this signal has been refined due to too many candle displaying in weak areas
!!!IF YOU DONT WANT TO USE PULLBACKS DURING DOWNTRENDS THEN USE THE EMA FILTER TO TURN OFF THE PULLBACKS WHEN PRICE IS BELOW THE MOVING AVERAGE!!!
//Rally candle (My personal Favourite) (((((WORKS BEST IN DOWNTRENDS AND TOP OF RANGES)))))
This candle is very powerful when used with simple Price Action such as Market Structure//Supply zones and Resistance zones.
//DAILY RALLY(Swing Traders)
snapshot
//4H RALLY(Swing Traders)
snapshot
- this signal will produce more signals due to the swing high filter on the 4H
!!!IF YOU DONT WANT TO USE RALLIES DURING UPTRENDSTHEN USE THE EMA FILTER TO TURN OFF THE RALLIES WHEN PRICE IS ABOVE THE MOVING AVERAGE!!!
//POWERFUL DOJIS (INDECISION)
snapshot
We look for indecision in key areas to see if momentum is shifting. When combined with Pullbacks or Rallys - this will enhance the odds of a probably area.
//HAMMERS
snapshot
//MOVING AVERAGES
snapshot
Short EMA = 50
Long EMA = 200
This filter can be used when the market is trending - look out for rejections off the moving averages
Also you can chance the Short And Long EMA to choose which MA cross you want to use
snapshot
ALSO ALL THE CANDLES HAVE A ALERT CONDITIONS WHICH YOU CAN ACCESS - THIS WILL ALERT ANY CANDLE YOU CHOOSE
Please leave a like/comment on this post as this is much appreciated....

AbdulLibraryLibrary "AbdulLibrary"
The library consists of three sections:
Technical Analysis Functions - A collection of tools commonly used by day traders
Trading Setup Filters Functions - A number of filters that help day traders to screen trading signals
Candlestick Pattern Detection Functions - To detect different candlestick patterns that are used in day trading setups
Note that this would have been possible without the help of @ZenAndTheArtOfTrading as I build-up this library after completing his pine script mastery course so big thanks to him
The content of the library are:-
fibLevels(preDayClose, preDayHigh, preDayLow) Calculates Daily Pivot Point and Fibonacci Key Levels
Parameters:
preDayClose : The previous day candle close
preDayHigh : The previous day candle high
preDayLow : The previous day candle low
Returns: Returns Daily Pivot Point and Fibonacci Key Levels as a tuple
bullishFib(canHigh, canLow, fibLevel) Calculates Fibonacci Levels in Bullish move
Parameters:
canHigh : The high of the move
canLow : The low of the move
fibLevel : The Fib level as % you want to calculate
Returns: Returns The Fib level for the Bullish move
bearishFib(canHigh, canLow, fibLevel) Calculates Fibonacci Levels in Bearish move
Parameters:
canHigh : The high of the move
canLow : The low of the move
fibLevel : The Fib level as % you want to calculate
Returns: Returns The Fib level for the Bearish move
getCandleSize() Calculates the size of candle (high - low) in points
Returns: Returns candle size in points
getCandleBodySize() Calculates the size of candle (close - open) in points
Returns: Returns candle body size in points
getHighWickSize() Calculates the high wick size of candle in points
Returns: Returns The high wick size of candle in points
getLowWickSize() Calculates the low wick size of candle in points
Returns: Returns The low wick size of candle in points
getBodyPercentage() Calculates the candle body size as % of overall candle size
Returns: Returns The candle body size as % of overall candle size
isSwingHigh(period) Checks if the price has created new swing high over a period of time
Parameters:
period : The lookback time we want to check for swing high
Returns: Returns True if the current candle or the previous candle is a swing high
isSwingLow(period) Checks if the price has created new swing low over a period of time
Parameters:
period : The lookback time we want to check for swing low
Returns: Returns True if the current candle or the previous candle is a swing low
isDojiSwingHigh(period) Checks if a doji is a swing high over a period of time
Parameters:
period : The lookback time we want to check for swing high
Returns: Returns True if the doji is a swing high
isDojiSwingLow(period) Checks if a doji is a swing low over a period of time
Parameters:
period : The lookback time we want to check for swing low
Returns: Returns True if the doji is a swing low
isBigBody(atrFilter, atr, candleBodySize, multiplier) Checks if a candle has big body compared to ATR
Parameters:
atrFilter : Check if user wants to use ATR to filter candle-setup signals
atr : The ATR value to be used to compare candle body size
candleBodySize : The candle body size
multiplier : The multiplier to be used to compare candle body size
Returns: Returns Boolean true if the candle setup is big
isSmallBody(atrFilter, atr, candleBodySize, multiplier) Checks if a candle has small body compared to ATR
Parameters:
atrFilter : Check if user wants to use ATR to filter candle-setup signals
atr : The ATR value to be used to compare candle body size
candleBodySize : The candle body size
multiplier : The multiplier to be used to compare candle body size
Returns: Returns Boolean true if the candle setup is small
isHammer(fibLevel, colorMatch) Checks if a candle is a hammer based on user input parameters and candle conditions
Parameters:
fibLevel : Fib level to base candle body on
colorMatch : Checks if user needs for the candel to be green
Returns: Returns Boolean - True if the candle setup is hammer
isShootingStar(fibLevel, colorMatch) Checks if a candle is a shooting star based on user input parameters and candle conditions
Parameters:
fibLevel : Fib level to base candle body on
colorMatch : Checks if user needs for the candel to be red
Returns: Returns Boolean - True if the candle setup is star
isBullEngCan(allowance, period) Check if a candle is a bullish engulfing candle
Parameters:
allowance : How many points the candle open is allowed to be off (To allow for gaps)
period : The lookback period for swing low check
Returns: Boolean - True only if the candle is a bullish engulfing candle
isBearEngCan(allowance, period) Check if a candle is a bearish engulfing candle
Parameters:
allowance : How many points the candle open is allowed to be off (To allow for gaps)
period : The lookback period for swing high check
Returns: Boolean - True only if the candle is a bearish engulfing candle
isBullDoji(maxSize, wickLimit, colorFilter) Check if a candle is a bullish doji candle
Parameters:
maxSize : Maximum candle body size as % of total candle size to be considered as doji
wickLimit : Maximum wick size of one wick compared to the other wick
colorFilter : Checks if the doji is green
Returns: Boolean - True if the candle is a bullish doji
isBearDoji(maxSize, wickLimit, colorFilter) Check if a candle is a bearish doji candle
Parameters:
maxSize : Maximum candle body size as % of total candle size to be considered as doji
wickLimit : Maximum wick size of one wick compared to the other wick
colorFilter : Checks if the doji is red
Returns: Boolean - True if the candle is a bearish doji
isBullOutBar() Check if a candle is a bullish outside bar
Returns: Boolean - True if the candle is a bullish outside bar
isInsideBar() Check if a candle is an inside bar
Returns: Returns Boolean - True if a candle is an inside bar

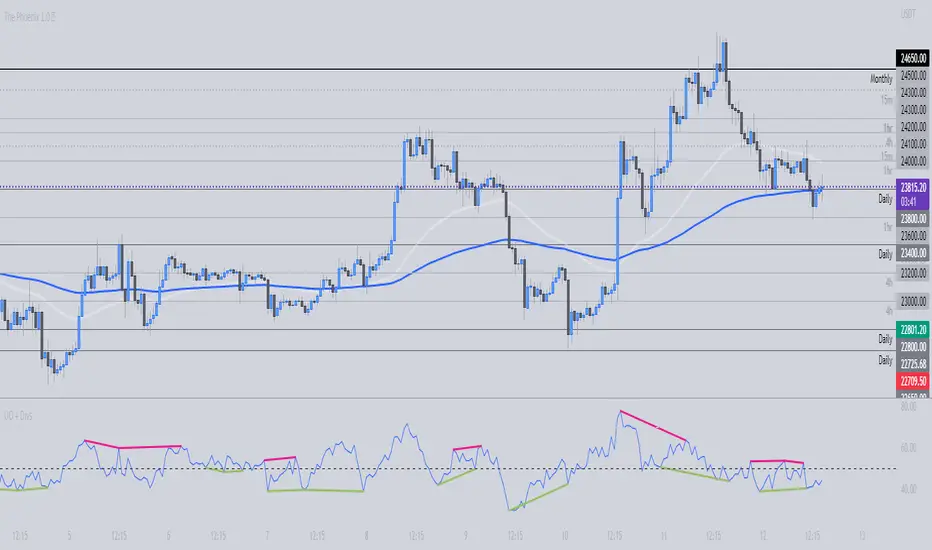
Swing Pivots High LowBINANCE:BTCUSDT
This indicator is an opensource merge of the built in 'Pivot Points High Low' and the most popular 'Swing-high-low-support-resistance' indicators. The original 'Pivot Points High Low' does not have extensions with better visibility, while the most popular 'Swing-high-low-support-resistance' has no source available. I've also added additional configurable alert conditions for Pivot High and Low Crossover/Crossunder.
Please read the official documentation for further information about the indicator.

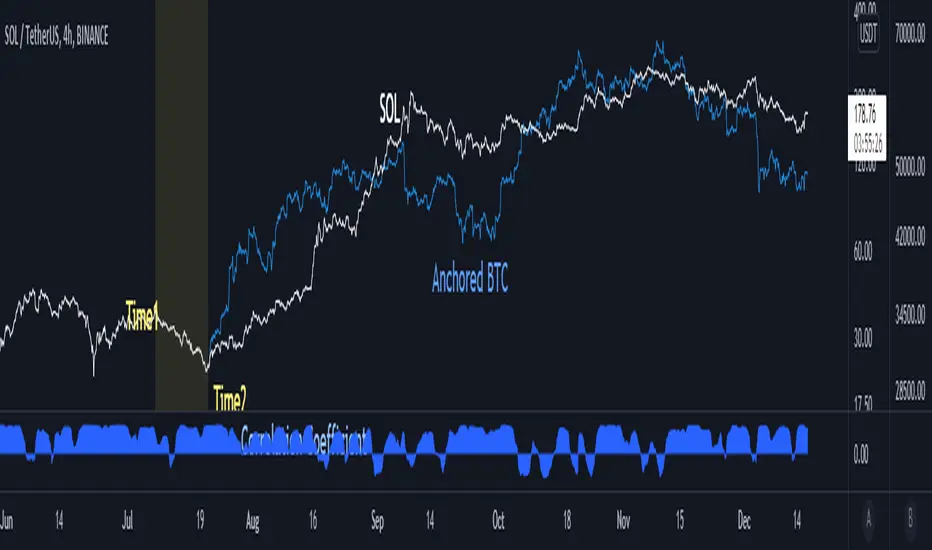
Anchored BTCIntroduce
When looking at altcoins and bitcoins together and seeing coupling and decoupling, we add a bitcoin chart in the "Compare" tab.
We checked where the coupling occurs in "Auto" mode, but if we move the chart, the overlapped position will change.
So I created the “Anchored BTC” indicator, which made the Bitcoin chart immovable.
How to use
First, add a bitcoin chart in the "Compare" tab and compare it with the altcoin chart.
And add the "Correlation Coefficient" built-in indicator to find the part where the correlation coefficient is 0.8 or higher.(it means finding well coupled part)
Among them, set the swing high or swing low part to Time1 and Time2.
Check if it looks the same as the existing BTC chart and you are done.
소개
알트코인과 비트코인을 함께 보며 커플링과 디커플링을 볼 때 우리는 비교 탭에서 비트코인 차트를 추가하여 봅니다.
"오토" 모드로 어느 부분에서 커플링이 일어나는지 체크했는데 차트를 옮기면 겹쳐놓아졌던 위치가 달라지게됩니다.
그래서 "Anchored BTC" 지표를 만들어, 비트코인 차트가 움직이지 못하게 만들었습니다.
사용법
우선 비교탭에서 비트코인차트를 추가하여 알트코인 차트와 비교해봅니다.
그리고 "상관계수" 빌트인 지표를 추가하여 상관계수가 0.8이상인 부분을 찾습니다.(커플링한 부분을 찾는겁니다)
이 중에서 스윙하이나 스윙로우인 부분을 Time1, Time2로 맞춰줍니다.
기존의 BTC차트와 동일하게 보여지는지 확인하면 끝납니다.
count pivot high/lowthis script count pivot higher high and pivot lower low ...its useful understanding swing of market bull pressure and bear pressure ..
when price make swing high it count +1 ..this script can help in price action manual trading understading high and low also newbie pinescript coder to learn counter ..i learn these thing from al brook price action trading books .
to make this script i took pivot high and low inbuild script from Tradingview ...to code this idea one of good friend @fikira helped me ..
in v2 version i hope will able to count intraday piovt high and low ..

FTB Strategy (Automated)Hey traders!
This is a profitable strategy script I created to teach my students how to automate their scripts using 3rd party APIs (more info available in my profile link at the bottom of this page).
What Is This?
This strategy is called the "Follow The Bear" strategy.
It's a forex trading strategy designed for one purpose and one purpose only: to take advantage of a recurring pattern on EURUSD's 1-Hour chart during the European market open.
The basic explanation is this:
During the European open we want to see a rally followed by a swing high shooting star / reversal pinbar candle. This typically means that traders buying EURUSD during the European/London open are now trapped long, and as price begins to retrace they are forced to sell, fueling a short-term retracement.
This strategy takes advantage of that pattern by aggressively selling short with a tight stop-loss above the pinbar candle and a conservative target.
There are many ways to trade this pattern, but this script represents my personal method for trading it.
It is not 100% accurate (no strategy is), but it does have a considerably high win rate over the past 6+ years considering its simplicity and I've been trading it for several months and can attest to its edge over the markets (at least through the Oanda data feed which is what I use).
The strategy rules are this:
Market: EURUSD
Timeframe: 1-Hour
Direction: Short Only
Timezone: 6AM-10AM GMT
Days: Tuesday, Wednesday, Thursday
Entry: Close of Pinbar Setup
Stop: 2 pips above signal candle
Target: 1:1
Risk: Up to you (backtest first! I use 1%)
The rule for the pinbar/shooting star candle pattern is that the candle must both open and close in the lower 50% of the bar's total size.
Automation
This script is already prepared to be auto-traded through a 3rd-party API that was created to relay TradingView alerts to your broker to execute and manage trades.
Sorry for the lack of information - due to TradingView's house rules I cannot go into any more detail here, but if you're interested in automating this script there is more info available in the resources offered under my profile link at the bottom of this page.
Disclaimer
The material and the resources offered here are for educational purposes only. Always do your own research and only execute trades based on your own personal judgement.
Trading foreign currencies can be a challenging and potentially profitable opportunity for investors. However, before deciding to participate in the forex market, you should carefully consider your investment objectives, level of experience, and risk appetite. Most importantly, do not invest money you cannot afford to lose.
There is considerable exposure to risk in any foreign exchange transaction. Any transaction involving currencies involves risks including, but not limited to, the potential for changing political and/or economic conditions that may substantially affect the price or liquidity of a currency, investments in foreign exchange speculation may also be susceptible to sharp rises and falls as the relevant market values fluctuate.
The leveraged nature of forex trading means that any market movement will have an equally proportional effect on your deposited funds. This may work against you as well as for you. Not only may investors get back less than they invested, but in the case of higher risk strategies, investors may lose the entirety of their investment. It is for this reason that when speculating in such markets it is advisable to use only risk capital.
Trading foreign exchange on margin carries a high level of risk, and may not be suitable for all investors. Past performance is not indicative of future results. The possibility exists that you could sustain a loss of some or all of your initial investment and therefore you should not invest money that you cannot afford to lose. You should be aware of all the risks associated with foreign exchange trading, and seek advice from an independent financial advisor if you have any doubts.

Gann Circle Swing LevelsThis indicator is based on W. D. Gann's Square of 9 Chart and can be interpreted as the Gann Circle / Gann Wheel / 360 Degree Circle Chart or Square of the Circle Chart.
Spiral arrangement of numbers on the Square of 9 chart creates a very unique square root relationship amongst the numbers on the chart. If you take any number on the Square of 9 chart, take the square root of the number, then add 2 to the root and re-square it, resulting in one full 360 degree cycle (i.e. a 360 degree Circle) out from the center of the chart.
For example,
the square root of 121 = 11,
11 + 2 = 13,
and the square of 13 = 169
The number 169 is one full 360 degree cycle out (with reference to 121) from the center of the Square of 9 chart.
Similarly, if you take any number on the Square of 9 chart, take the square root of the number, then subtract 2 from the root and re-square it, resulting in one full 360 degree inward rotation towards the center of the chart.
For example,
the square root of 565 = 23.77,
23.77 - 2 = 21.77,
and the square of 21.77 = 473.93 (approximately equal to 474, which is directly below 565 on the Square of 9 chart)
The number 474 is one full 360 degree inward rotation (with reference to 565) towards the center of the chart.
How to Use this Indicator ?
This indicator is useful for finding coordinate squares on the Gann Circle that are making hard aspects to a previous position (such as a significant top or bottom) on the circle.
Input :
Swing Point (Significant price point, such as a top or a bottom)
Low / High ? (Is it a bottom or a top)
Number of Gann Levels (Number of Gann Cycles to be projected)
Output :
Gann Support or Resistance Levels (color coded as follows) :
Swing High or Swing Low (BLUE)
Support levels calculated with reference to the Swing High (RED)
Resistance levels calculated with reference to the Swing Low (LIME)

Gann RetracementThe indicator is based on W. D. Gann's method of retracement studies. Gann looked at stock retracement action in terms of Halves (1/2), Thirds (1/3, 2/3), Fifths (1/5, 2/5, 3/5, and 4/5) and more importantly the Eighths (1/8, 2/8, 3/8, 4/8, 5/8, 6/8, and 7/8). Needless to say, {2, 3, 5, 8} are the only Fibonacci numbers between 1 to 10. These ratios can easily be visualized in the form of division of a Circle as follows :
Divide the circle in 12 equal parts of 30 degree each to produce the Thirds :
30 x 4 = 120 is 1/3 of 360
30 x 8 = 240 is 2/3 of 360
The 30 degree retracement captures fundamental geometric shapes like a regular Triangle (120-240-360), a Square (90-180-270-360), and a regular Hexagon (60-120-180-240-300-360) inscribed inside of the circle.
Now, divide the circle in 10 equal parts of 36 degree each to produce the Fifths :
36 x 2 = 72 is 1/5 of 360
36 x 4 = 144 is 2/5 of 360
36 x 6 = 216 is 3/5 of 360
36 x 8 = 288 is 4/5 of 360
where, (72-144-216-288-360) is a regular Pentagon.
Finally, divide the circle in 8 equal parts of 45 degree each to produce the Eighths :
45 x 1 = 45 is 1/8 of 360
45 x 2 = 90 is 2/8 of 360
45 x 3 = 135 is 3/8 of 360
45 x 4 = 180 is 4/8 of 360
45 x 5 = 225 is 5/8 of 360
45 x 6 = 270 is 6/8 of 360
45 x 7 = 315 is 7/8 of 360
where, (45-90-135-180-225-270-315-360) is a regular Octagon.
How to Use this indicator ?
The indicator generates Gann retracement levels between any two significant price points, such as a high and a low.
Input :
Swing High (significant high price point, such as a top)
Swing Low (significant low price point, such as a bottom)
Degree (degree of retracement)
Output :
Gann retracement levels (color coded as follows) :
Swing High and Swing Low (BLUE)
50% retracement (ORANGE)
Retracements between Swing Low and 50% level (RED)
Retracements between 50% level and Swing High (LIME)

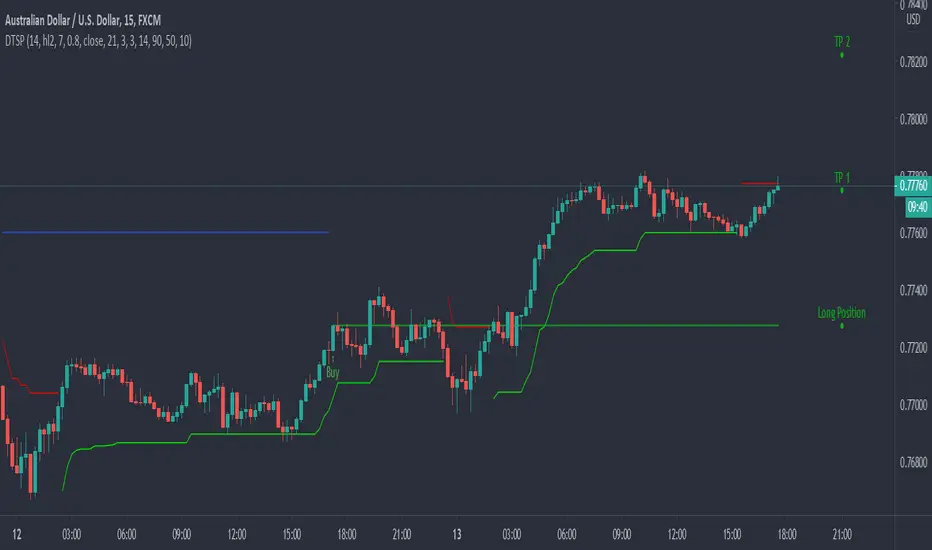
Dynamic Take Profit & Signals (AussieBogan)Dynamic Take Profit & Signals (DTS) help us to dynamically place potential take profit levels. These levels are measured based on standard deviation in conjunction with swing high and low points. Head over to the settings to control your take profit and multiplicative factor setting.
In short, higher values of either setting will return more spread out between tp's. The logic behind using the standard deviation is that a low value of it will return tp closer to where you entered the trade, as such it will have higher chances of the price reaching them.
The Indicator also has alert features for buy and sell so any trader can be aware of every potential signal the indicator produces.


Previous Highs and Lows (M, W, D) Displays previous Monthly, Weekly, and Daily key swing highs/lows with clean , timeframe-specific coloring. Essential structure reference for multi-timeframe traders!!
Your Monthly/Weekly/Daily structural backbone in one indicator!!!!

Timeframe-Independent Anchored VWAPAn anchored VWAP (Volume Weighted Average Price) that produces identical values (down to the tick!) across different timeframes (unlike, for example, TradingView's built-in Anchored VWAP).
Advantages
This indicator calculates identical values whether you view it on 1m, 5m, 15m, or any other timeframe within reasonable ranges. Even challenging non-integer timeframe ratios like calculating on 2m while viewing on 3m are handled perfectly. In High or Low mode, VWAP will anchor precisely at the selected candle's high/low. As usual for AVWAP, up to 3 standard deviation bands are supported.
How to Use
Setting the Anchor: When the indicator is added, select your anchor time. This is typically placed at a significant swing high/low or session open.
Source Selection: Choose whether to anchor from High, Low, or Close price.
Calculation Timeframe: Select the timeframe used for VWAP calculation.
For intraday trading (1m-1H charts): Just keep the default setting (1m)
For swing trading (4H-D charts): Use 5m or 15m calculation timeframe
For position trading (D-W charts): Use 1H calculation timeframe
Important: Lower calculation timeframes provide more precise data but may hit Pine Script's bar limit on very long timeframes
Standard Deviation Bands: Enable additional band sets as needed for your trading style.
Technical Implementation
The indicator achieves timeframe independence through the following algorithm:
Lower Timeframe Sampling: Uses Pine Script's request.security_lower_tf() to retrieve bar data at the specified calculation timeframe, regardless of the viewing timeframe. This provides consistent data resolution across all chart timeframes.
Anchor Detection: Scans the lower timeframe data to identify the exact bar containing the selected anchor price. The algorithm handles both simple cases (where anchor falls on a complete bar) and complex cases (where anchor falls within a split bar in non-integer timeframe ratios like calculating on 2m while viewing on 3m).
FIFO Buffer Management: Maintains a First-In-First-Out buffer of lower timeframe bars. On each chart bar:
Adds new lower timeframe bars to the buffer
Processes exactly one period worth of bars (matching the viewing timeframe)
Removes processed bars from the buffer
This approach ensures consistent calculation regardless of viewing timeframe.
First Bar Initialization: On the anchor bar, processes only the single anchor bar to ensure the VWAP starts exactly at the anchor price. Subsequent bars process the full period, maintaining mathematical accuracy.
VWAP Calculation: Applies the standard volume-weighted average price formula:
VWAP = Σ(Price × Volume) / Σ(Volume)
StdDev = √(Σ(Price² × Volume) / Σ(Volume) - VWAP²)
All calculations accumulate from the anchor point forward.
Visual Continuity: For edge cases where the anchor falls in an incomplete bar (e.g., calculating on 2m while viewing on 3m), displays the anchor price as a visual placeholder until the actual calculation begins on the next bar. This ensures the line always starts visually at the anchor point.

AutoTrend Trader Description
AT_Trader automatically detects and draws trendlines by connecting swing highs (resistance trendlines) and swing lows (support trendlines). The system also detects trendline breakouts with optional buffer zones to filter false breaks.

SwingStructure Pro Description
SwingStructure provides clean identification of swing highs and swing lows at multiple levels (minor, intermediate, major), plotting the market's structural rhythm. Understanding swing structure is fundamental to all price action trading methods.
